WatchPoint

Time travel debugging in GDB
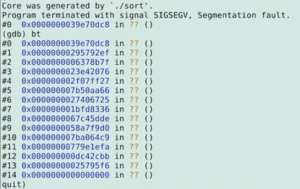
Time travel debugging (also sometimes called reversible debugging) is a handy feature of some debuggers that allows you to step back through the execution of a program and examine the data prior to an exception being thrown or a breakpoint being reached (as opposed to only being able to view data at that time and onwards). This can be especially helpful for examining errors that only appear once in a thousand runs, or after several hours of a program running. GDB has the feature built in, and some dedicated time travel debuggers such as rr and UDB/LiveRecorder exist too. Note: this 7 minute clip is an extract of my talk at C++ on Sea in July 2022. You can watch the full presentation on the C++ on Sea YouTube channel. Let’s say we have this program and don’t know where the issue is: Most of the time, this program will execute correctly, and generate some random numbers and sort them, however occasionally this program will get a Segmentation Fault. However, attempting to debug it the usual way will not reveal much useful data. We can inspect the core dump in gdb: However looking at this has proven unhelpful, as none of the data can be inspected. We just know that the stack has corrupted, which it told us when the program crashed initially. Now let’s try running the sort with GDB recording enabled. Now we’ve run the program in gdb repeatedly so we can catch when the program throws an exception while recording. When this happens, the backtrace shown is still not particularly useful, but we can have a look at the program counter and see that where it was trying to jump to is invalid. However, we can step backwards through the program’s execution to see what it tried to do immediately before the Segfault. Perhaps expected of a smashed stack, the program has failed when trying to return to where the stack was pointing to, as the stack has corrupted and the address stored is invalid. Having a look at the memory at the stack pointer we can see it is pointing to the invalid address we found earlier. Now we can set a watchpoint on this address and reverse-continue to see the line of code that most recently wrote to the stack. As we can see, it has failed when writing to the element of the array at the position currently referenced by Ah, And yes, we are calling modulo the number of bytes in the array instead of the number of elements in the array, meaning sometimes the program will try to write outside of the array. So we have shown an example use case of how to use time travel debugging and its advantages. This is a fairly short program, so using the GDB inbuilt reversible debugging was alright, but compared to other solutions it is very slow. rr (record and replay) is much faster; but it has limited support for different features based on the platform (such as needing access to the performance counters, or certain types of program, like ones that use shared memory or async I/O). So if rr doesn’t work for you, check out UDB and LiveRecorder – they cover all bases. 🙂 (i.e. work on almost any program no matter how complex and in almost any Linux environment)What is time travel debugging?
Normal GDB Debugging Process
#include <stdio.h>
#include <stdbool.h>
#include <time.h>
#include <stdlib.h>
#include <string.h>

void sort(long* array) {
    int i = 0;
    bool sorted;

    do {
    sorted = true;

    for( i = 0; i < 31; i++ ) {
    long* item_one = &array[i];
    long* item_two = &array[i+1];
    long swap_store;

    if( *item_one <= *item_two ) {
    continue;
    }

    sorted = false;
    swap_store = *item_two;
    *item_two = *item_one;
    *item_one = swap_store;
    }
    } while( !sorted );
}

int main() {
    long array[32];
    int i = 0;

    srand(time(NULL));
    for( i = 0; i < rand() % sizeof array; i++ ) {
    array[i] = rand();
    }

    sort(array);

    return 0;
}
*** stack smashing detected ***: terminated
Aborted (core dumped)
$ ls -ltg core* | head
-rw------- 1 usr usr 300k Jul 7 10:20 core.194855
$ gdb -c core.194855
GDB With Recording
$ gdb sort
(gdb) b main                     	# set a breakpoint on main()
(gdb) r                          	# resume
(gdb) b _exit                    	# set a breakpoint on exit
(gdb) commands 1                 	# record and continue when it reaches main
> record
> continue
> end
(gdb) commands 2                 	# rerun the program when it exits
> run                            	# to run it until it errors
> end
(gdb) set confirm off            	# so the program can restart without input
(gdb) c
(gdb) p $pc                 	# check the program counter
$1 = (void (*)()) 0x23b16c11
(gdb) x $1                  	# examine memory at that address
0x23b16c11:   	Cannot access memory at address 0x23b16c11
(gdb) reverse-stepi
0x0000555555550f8 in main () at bubble_sort.c:43
43    	}
(gdb) p $sp
$2 = (void *) 0x7fffffffda98
(gdb) x $2
0x7fffffffda98: 0x23b16c11


(gdb) watch * (void**) $2
(gdb) reverse-continue
Continuing.

Thread 1 "sort" hit Watchpoint 3: * (void**) $2

Old value = (void *) 0x23b16c11
New value = (void *) 0x7ffff7dabfd0 <__libc_start_call_main+128>
0x000055555555550cf in main () at bubble_sort.c:37
37    	array[i] = rand();
i. As we are back to a point in the program’s execution where the stack isn’t corrupted, we can examine the array to figure out what went wrong.(gdb) print i
$3 = 35
(gdb) whatis array
type = long [32]
i = 35 but the array is only of length 32. From this we can infer that the line randomly choosing the maximum i is at fault.for( i = 0; i < rand() % sizeof array; i++ ) {Conclusion
Get tutorials straight to your inbox
Become a GDB Power User. Get Greg’s debugging tips directly in your inbox every 2 weeks.

